Iniciar sesión
Mathematics for IGCSE & O level - Statistical Diagrams (Section 2 - No. 41)
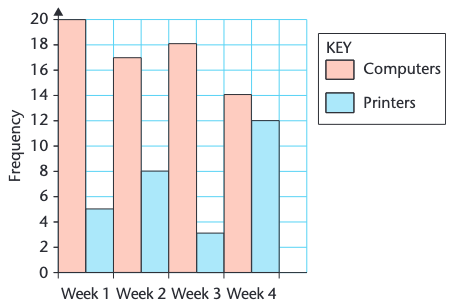
In which week were the most printers sold?
Week 1
Week 2
Week 3
Week 4
Explicación
The blue bar, representing printers, is highest in Week 2.
Comentarios (0)
Inicia sesión para comentar
Anuncio
Permitir que javascript cargue correctamente esta página